Part of 6. IsurDASH Platform.
6.4. Alarms
This section provides a complete and detailed historical record of all alarm events generated by the fleet of ISURLOG devices. Unlike the Dashboard's alarm panel, which only shows the most recent/unread events, here the user can consult, filter, and analyze the entire alarm history. It has two tabs: Resumen and Listado De Alarmas.
Resumen
An analytics view of alarms across the whole fleet:
- Totals: Total, Sin leer, Batería (low-battery alarms), Fuera de rango (out-of-range value alarms), Sin datos, and Isurlogs sin alarmas.
- Alarmas por tipo: a breakdown chart by alarm type (low battery vs. out-of-range).
- Alarmas por día and Alarmas por franja horaria: when alarms have been happening, by day and by time of day.
- Isurlogs con más alarmas: a ranking of which devices have generated the most alarms.
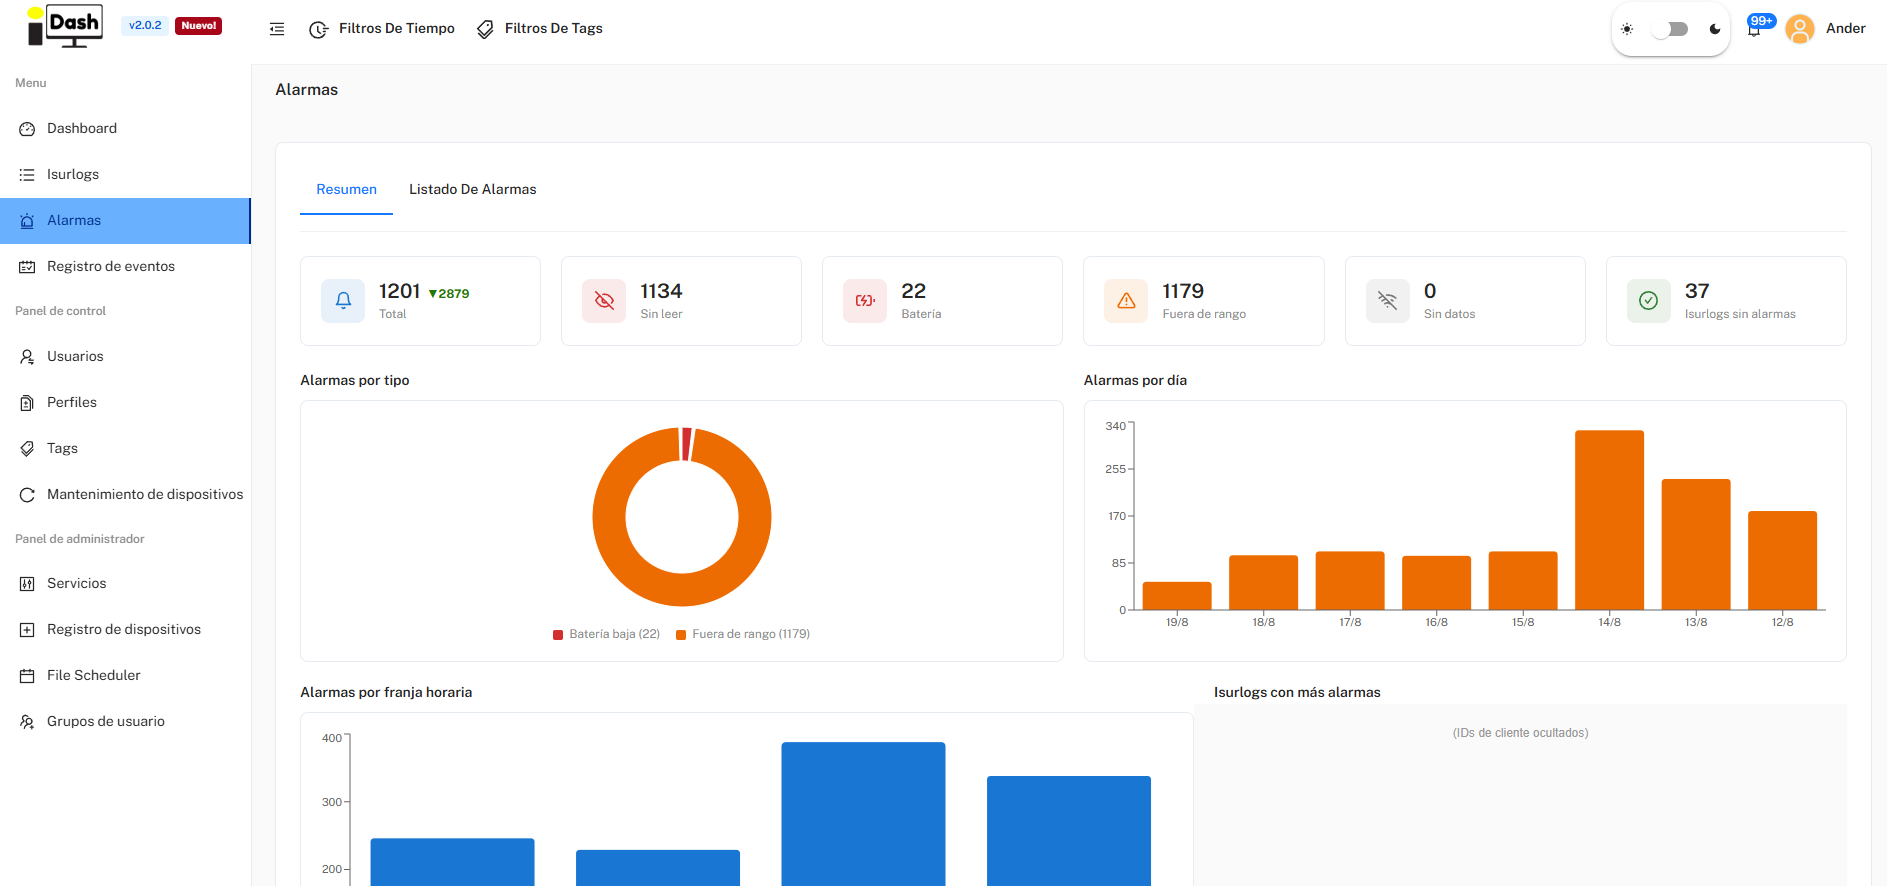
The Resumen tab — fleet-wide alarm analytics.
Listado De Alarmas
A searchable, filterable table listing each alarm event individually:
| Column | Description |
|---|---|
| Tipo | The nature of the alarm (e.g., "Valor fuera de rango," "Batería baja"). |
| Isurlog | The device name and ID that generated the alarm. |
| Detalle | The sensor or measurement that triggered the alarm (e.g., "Humedad interna"). |
| Valor | The exact value that was measured and triggered the alarm. |
| Fecha | When the ISURLOG recorded and transmitted the alarm event. |
| Estado | Whether the alarm has been read. |
A search box (by Isurlog, name, or description), a type filter (Todos los tipos / Valor fuera de rango / Batería baja), and a read-status filter (Todas / Sin Leer / Leídas) let you narrow down the list. Columns are sortable.
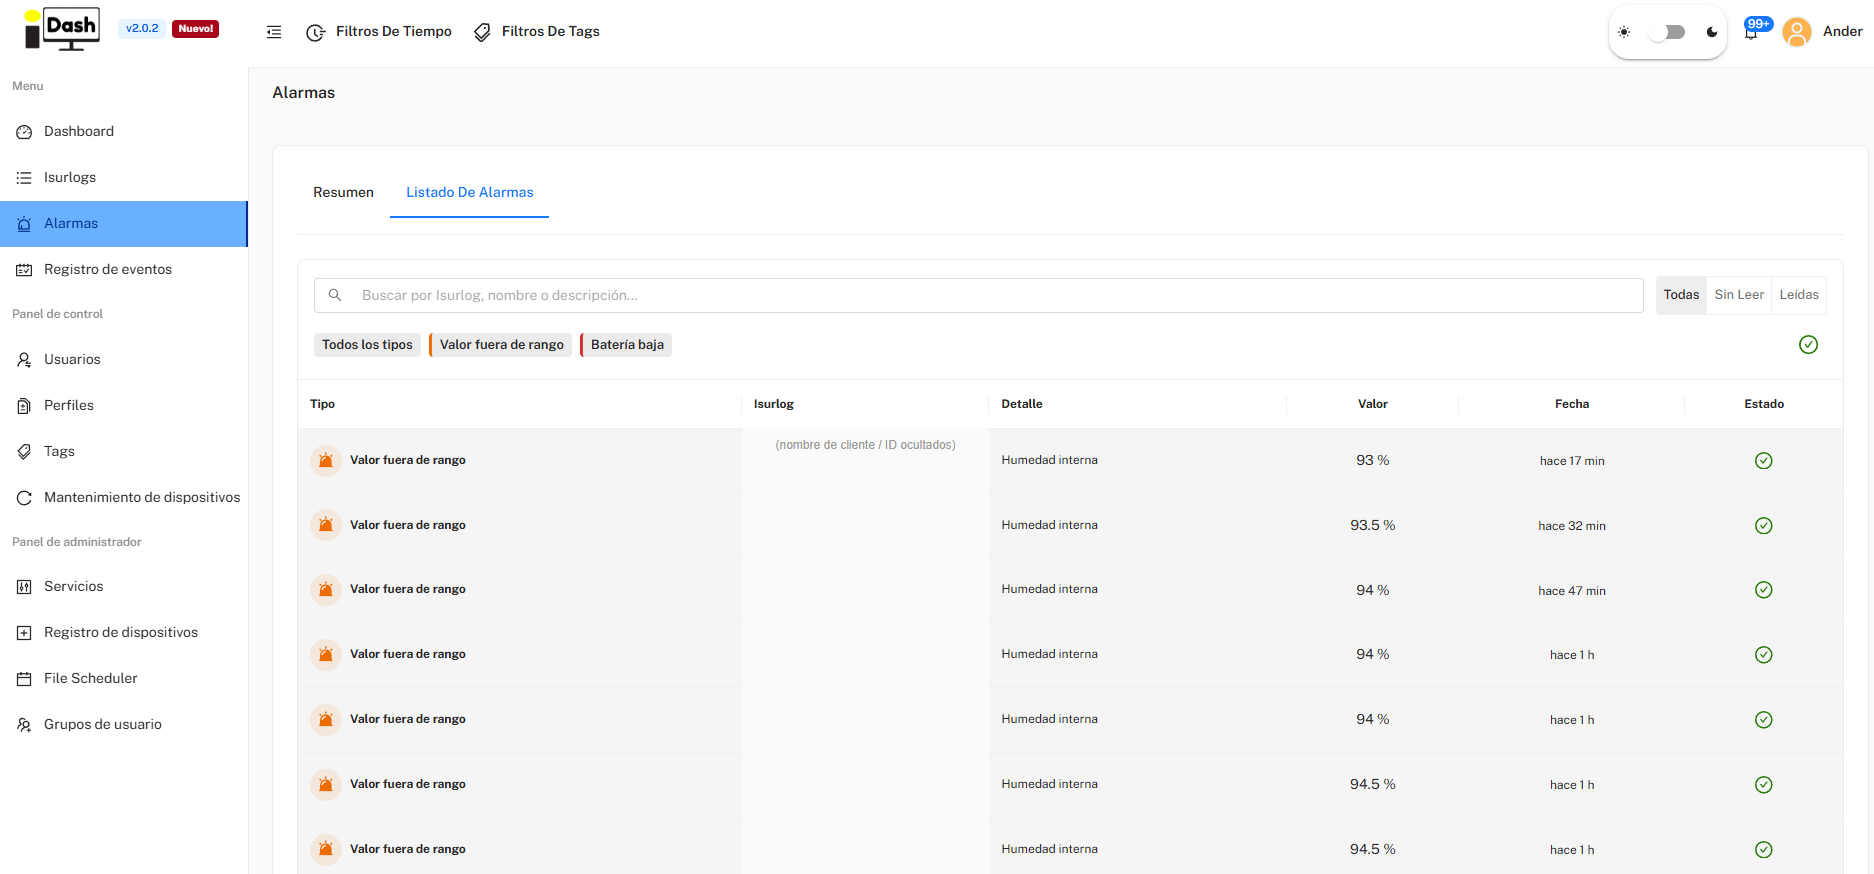
The Listado De Alarmas tab — the full, filterable alarm history.