6.5. Event Log
The Registro de eventos page is the activity history of the fleet: everything that happens to the ISURLOGs besides alarms. That includes synchronizations, configuration changes, sensors added or removed, firmware updates, remote consoles, connectivity events and manual maintenance work. For alarms, see 6.4. Alarms.
The events of a single device are also available in its own Registros tab (see 6.3.5). This page shows them for all devices at once.
The page has two tabs: Resumen and Listado De Eventos. Like the rest of the platform, both follow the global Filtros de tiempo and Filtros de Tags in the top bar (see 6. IsurDASH Platform).
Resumen
Four indicators sum up the period:
- Eventos en el periodo: total number of events.
- Isurlogs afectadas: how many different devices had at least one event.
- Eventos automáticos: events generated by the platform or by the device itself.
- Eventos manuales: events logged by a person.
Below the indicators there are two panels:
- Eventos por tipo: one bar per event type with its number of events, grouped as AUTOMÁTICOS and MANUALES. The types are described in the table below.
- Isurlogs con más actividad: a ranking of the devices with the most events, with their name, ID and number of events.
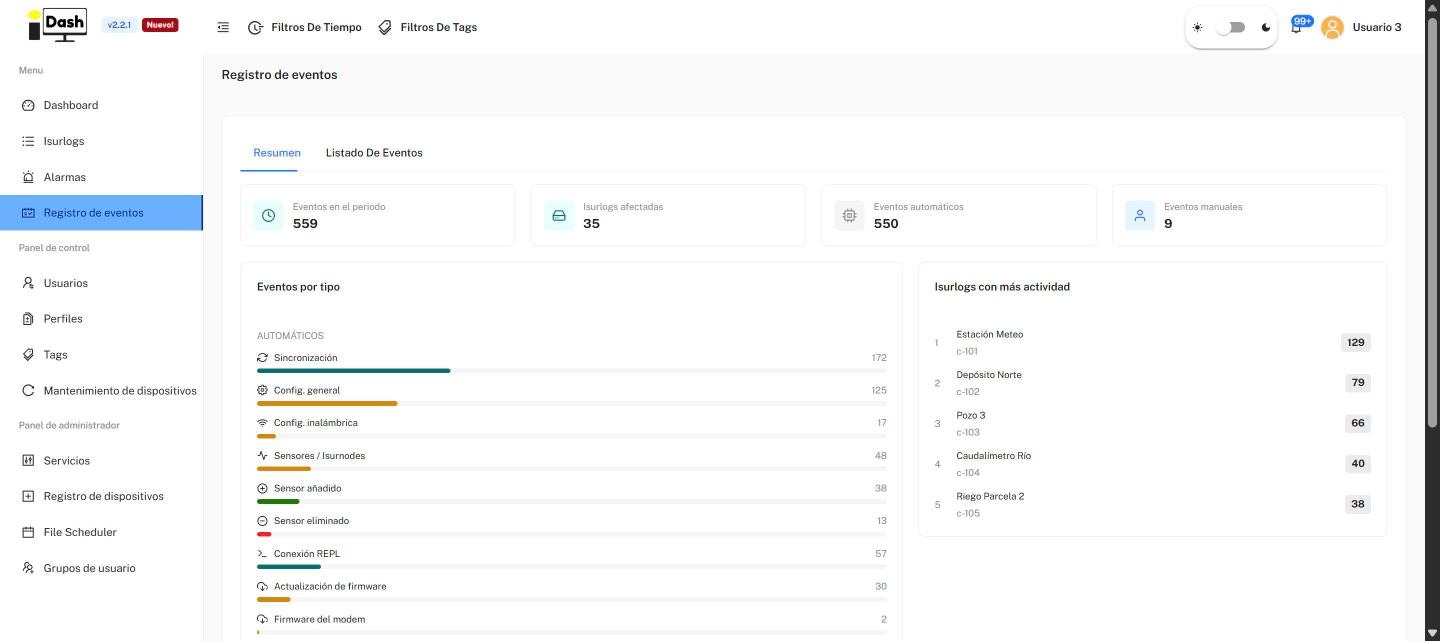
The Resumen tab — indicators, events by type and the most active devices (sample data).
Event types
| Type | Mode | What it records |
|---|---|---|
| Sincronización | Automático | A synchronization request was sent to the device. |
| Config. general | Automático | The device's general configuration was changed. |
| Config. inalámbrica | Automático | The wireless configuration was changed. |
| Sensores / Isurnodes | Automático | Changes in the sensors or the Isurnodes of the device. |
| Sensor añadido | Automático | A sensor was added to the device. |
| Sensor eliminado | Automático | A sensor was removed from the device. |
| Conexión REPL | Automático | A REPL session was opened on the device (see 6.9. Device Maintenance). |
| Actualización de firmware | Automático | The firmware of the ESP32 was updated. |
| Firmware del modem | Automático | The firmware of the modem was updated. |
| Archivos del dispositivo | Automático | Activity on the device's files. |
| Conexión de datos activada | Automático | The device established a new data connection. The description includes the operator and, when applicable, how long the device was without a data connection. |
| Conexión de datos eliminada | Automático | A data connection was dropped. The description includes the operator and says if it was not reactivated afterwards. |
| Reinicio de conectividad | Automático | The device's connectivity was restarted. |
| Mantenimiento correctivo | Manual | A corrective maintenance task, logged by hand. |
| Calibración de sensor | Manual | A sensor calibration, logged by hand. |
| Cambio de batería | Manual | A battery change, logged by hand. |
Manual events are created from a device's own Registros tab, with the Registrar evento manual button (see 6.3.5).
Listado De Eventos
The full history, with the most recent events first. At the top of the tab:
- Search box: looks for events by Isurlog, description or user.
- Todos / Automático / Manual: filters by the mode of the event.
- Type chips: filter by event type. Todas las acciones shows every type; the other chips are the ones in the table above.
The table has these columns:
- Tipo: whether the event is Automático or Manual.
- Acción: the event type.
- Isurlog: the name and ID of the device.
- Descripción: what happened.
- Usuario: the user the event is attributed to.
- Fecha: how long ago it happened (for example, "hace 3 h").
- Abrir: opens a window with the full description, the user, the exact date and time, and the Isurlog.
At the bottom of the table you choose how many rows to show per page (15 by default) and see the total number of events.
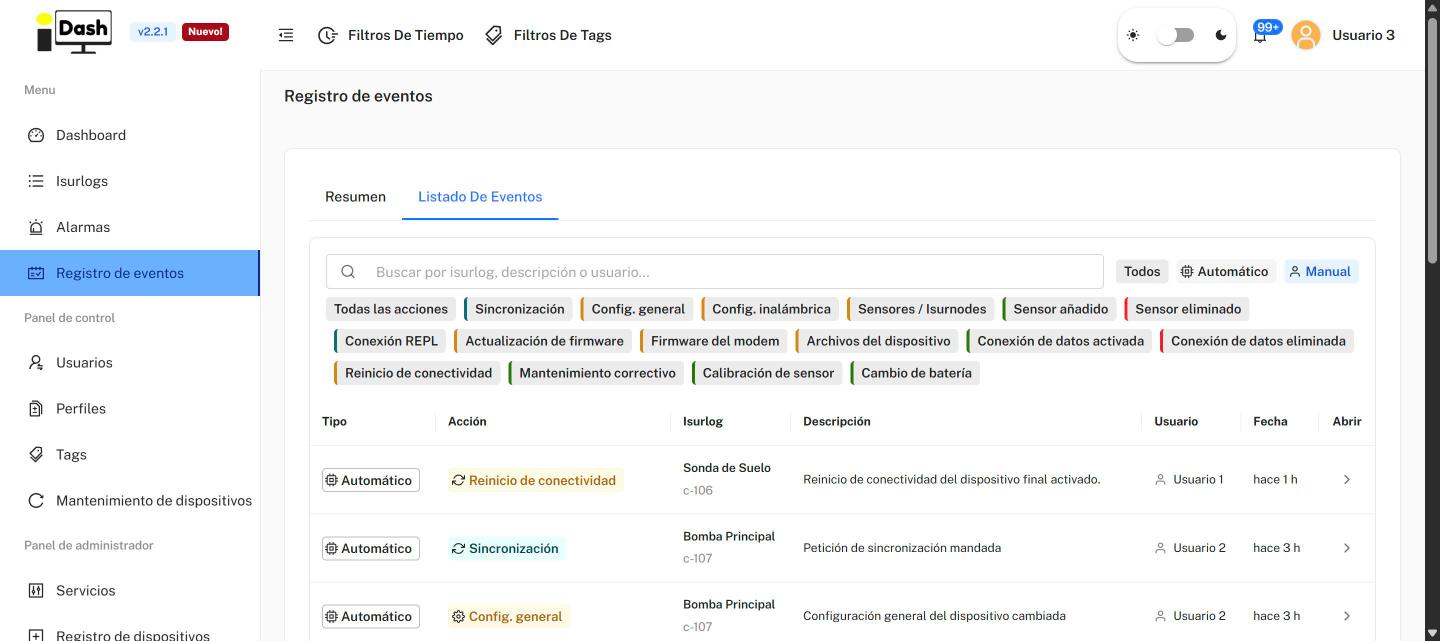
The Listado De Eventos tab — search, filters and the event table (sample data).
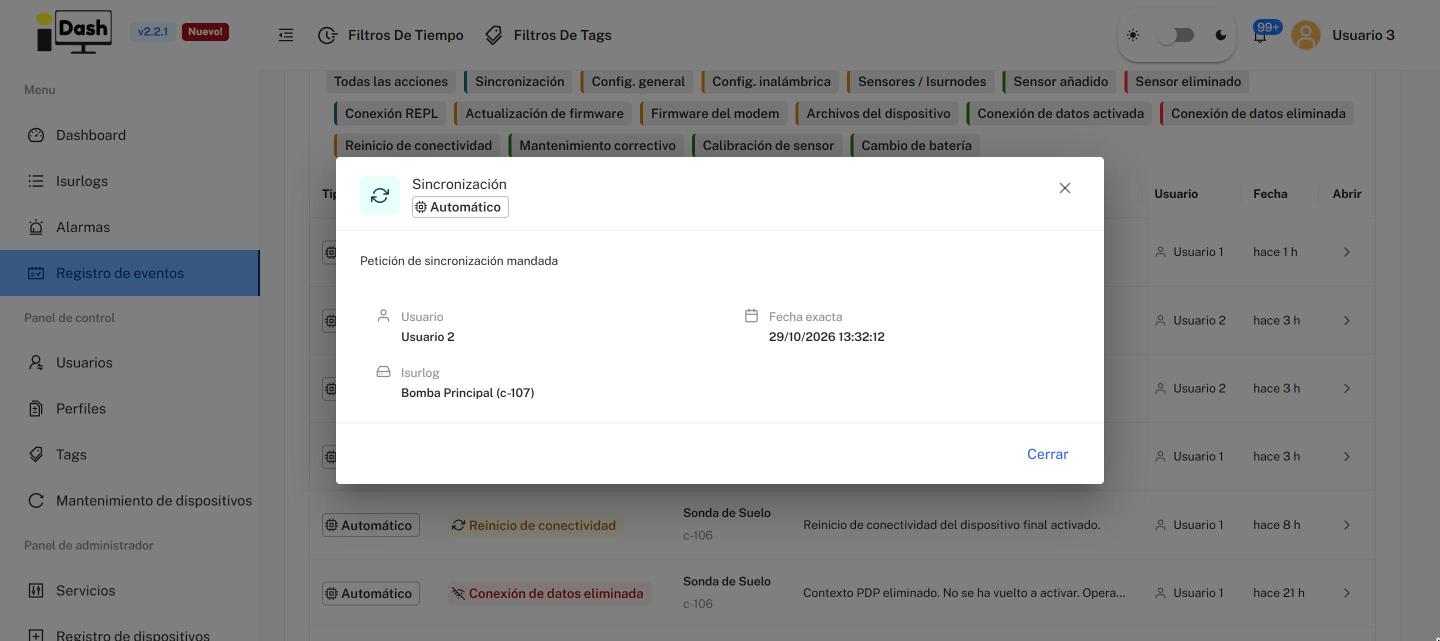
The detail window opened with the Abrir button (sample data).