Part of 6. IsurDASH Platform.
6.2. Main Control Panel (Dashboard)
The Dashboard is the main screen to which the user is directed after logging in. Its objective is to provide a quick, overall view of the complete status of the ISURLOG device fleet.
The page is organized into two main areas:
Fleet Map and Alarms Panel
At the top, an interactive map shows the geographical location of every ISURLOG in the fleet, color-coded by status (Online, Offline, Low battery, Unread alarm). A search box and status filters let you narrow down which devices are shown on the map.
Next to the map, a panel with three tabs gives quick access to what needs attention:
- Alarmas: unread and recently-read alarms across the whole fleet, with the affected device and a short description of each event. From here you can also view an alarm's details and mark it as read.
- Atención: Isurlogs that need urgent attention — devices that aren't transmitting, or that will soon stop transmitting due to low battery.
- Tendencias: alarm trends for the fleet: alarms compared to the previous period of equal length, alarms broken down by type (low battery vs. out-of-range values), which Isurlogs have generated the most alarms, and the day-by-day evolution of alarms.
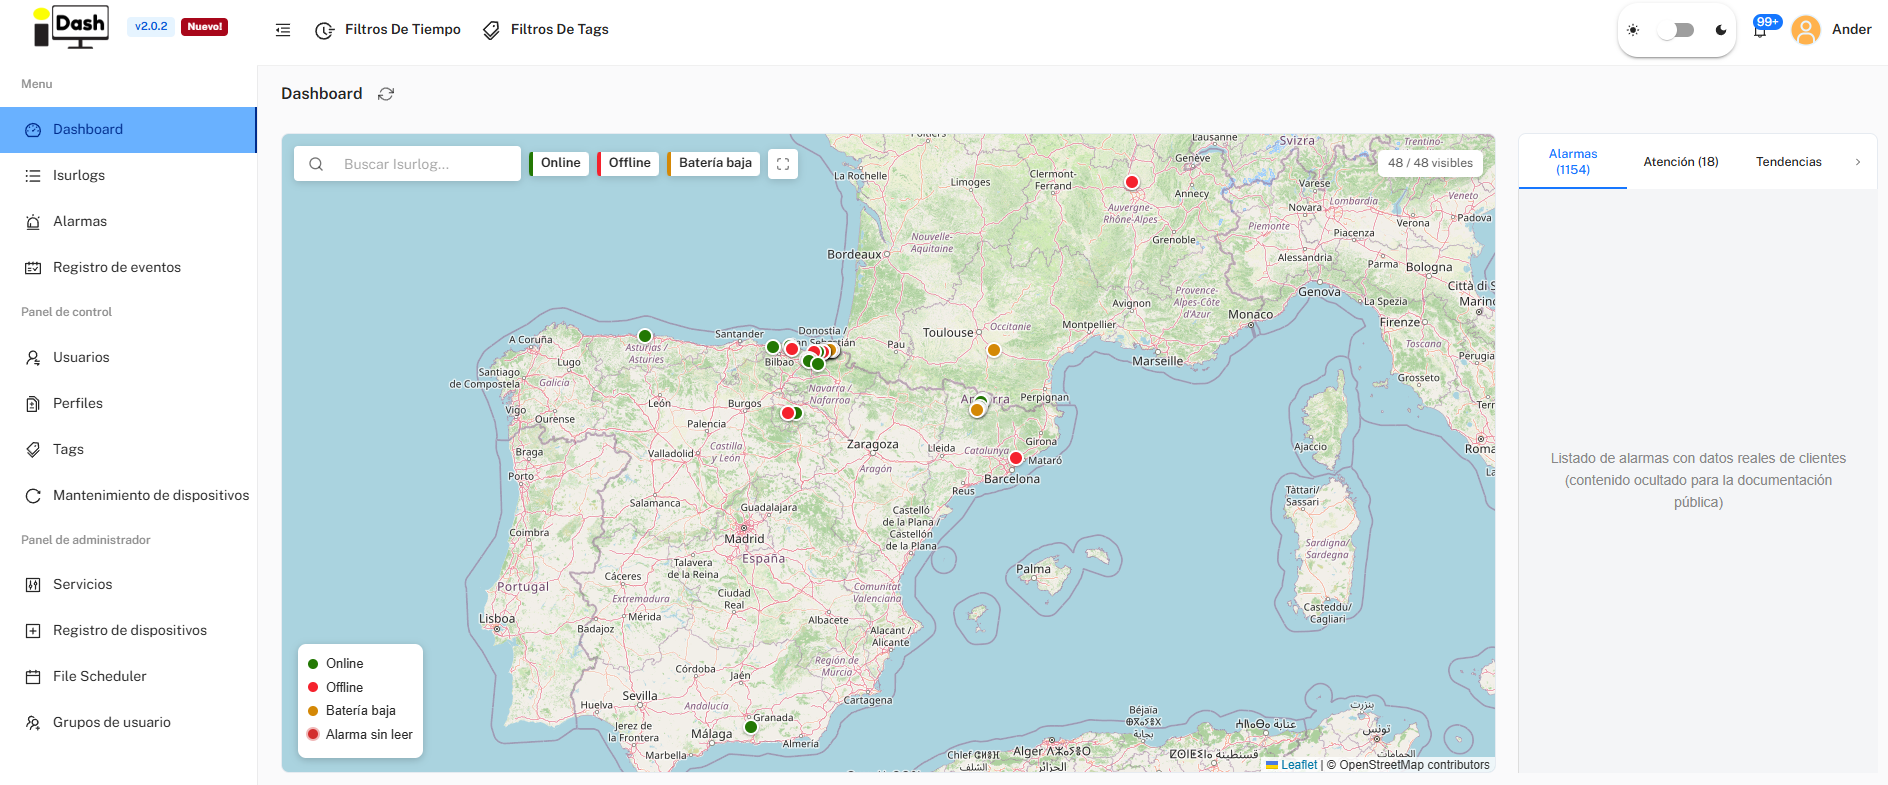
The fleet map and alarms panel.
Fleet Summary and Charts
Below the map, three tabs give access to different information: Resumen, Novedades, and Soporte.
The Resumen tab shows an instant summary of the fleet's status:
- Isurlogs: total number of dataloggers registered in the account.
- Online / Offline: how many devices have/haven't transmitted recently.
- Alarmas: total number of alarm events recorded by the devices.
- Batería baja: number of devices currently reporting low battery.
Below the numeric summary, two charts are shown:
- Datos transmitidos e isurlogs online: a bar chart with the fleet's daily activity — data points transmitted and devices online, day by day.
- Distribución de batería: a donut chart breaking down the fleet by battery health (Buena / Baja / Crítica / Sin datos).
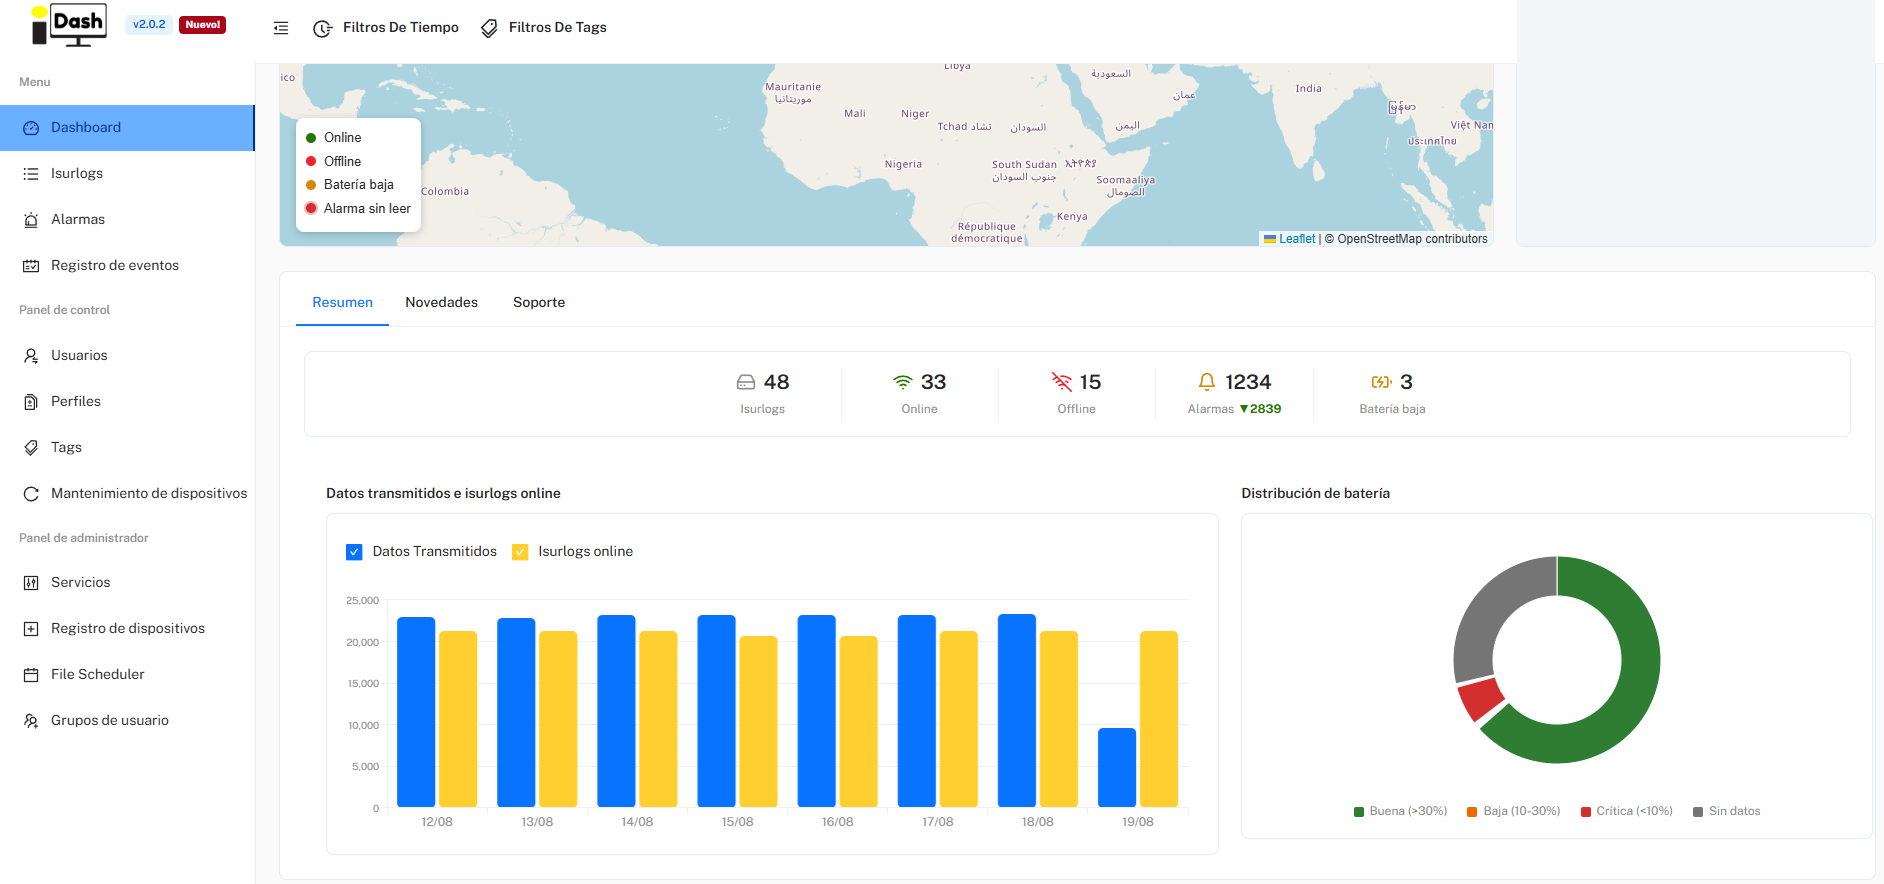
The Resumen tab — fleet numbers and charts.
The Novedades tab lists what's new in IsurDASH, release by release.